
Each platform's own numbers. One Analytics page.
Schedchie analytics puts eleven platforms' own numbers on one page, on every plan from €7.99 a month. Every connected account in one overview: pick a date range, compare it with the period before, filter by client group or platform, export to CSV.
14-day free trial · Cancel anytime, no questions asked

11 platforms report their own numbers
Read from each platform's own API. X shows what you published through Schedchie (X add-on, €4.99 per 30 posts).
- Followers and post count, plus likes and comments on your latest posts.
- Page followers and likes, plus likes, comments and shares on your latest posts.
- TikTok
- Followers gained and lost by day, profile and video views, likes, comments, shares, per-video reach, watch time and completion rate, audience by age, gender and location, and its online hours.
- Profiles: impressions, reach, reactions, comments, reposts, saves and watch time on posts published through Schedchie. Pages: followers by day, page views, and followers by industry, seniority, company size and country.
- Impressions, saves, pin clicks and outbound clicks by day and per pin, plus followers and monthly views.
- YouTube
- Subscribers and channel views, plus views, likes and comments on recent videos.
- Threads
- Followers and link clicks, views, likes, replies, reposts and quotes for the account and on each post, views by day, and followers by country once an account has 100.
- Bluesky
- Likes, reposts, replies, quotes and saves on recent posts, and followers by day.
- Mastodon
- Favourites, boosts, replies and quotes on recent posts, engagement by publish day, and followers by day.
- Telegram
- Subscribers or members by day, and reactions on channel posts sent through Schedchie.
- Google Business Profile
- Maps and Search views, website clicks, calls and direction requests by day, and the top 15 searches each month.
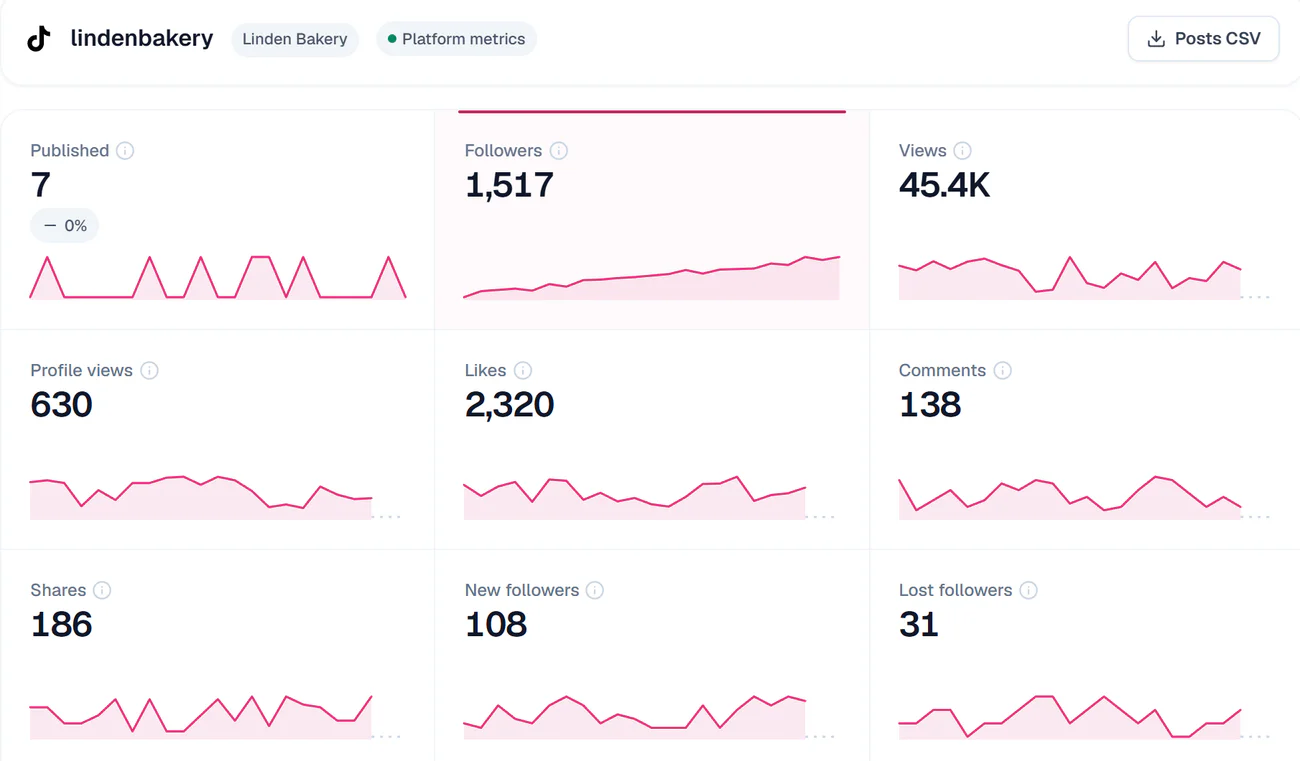
Open one account, see all of it
Each account's page shows what its platform reports, day by day, against the period before, with its posts in a sortable table and a CSV of them.
TikTok, as it reads on the sample workspace.
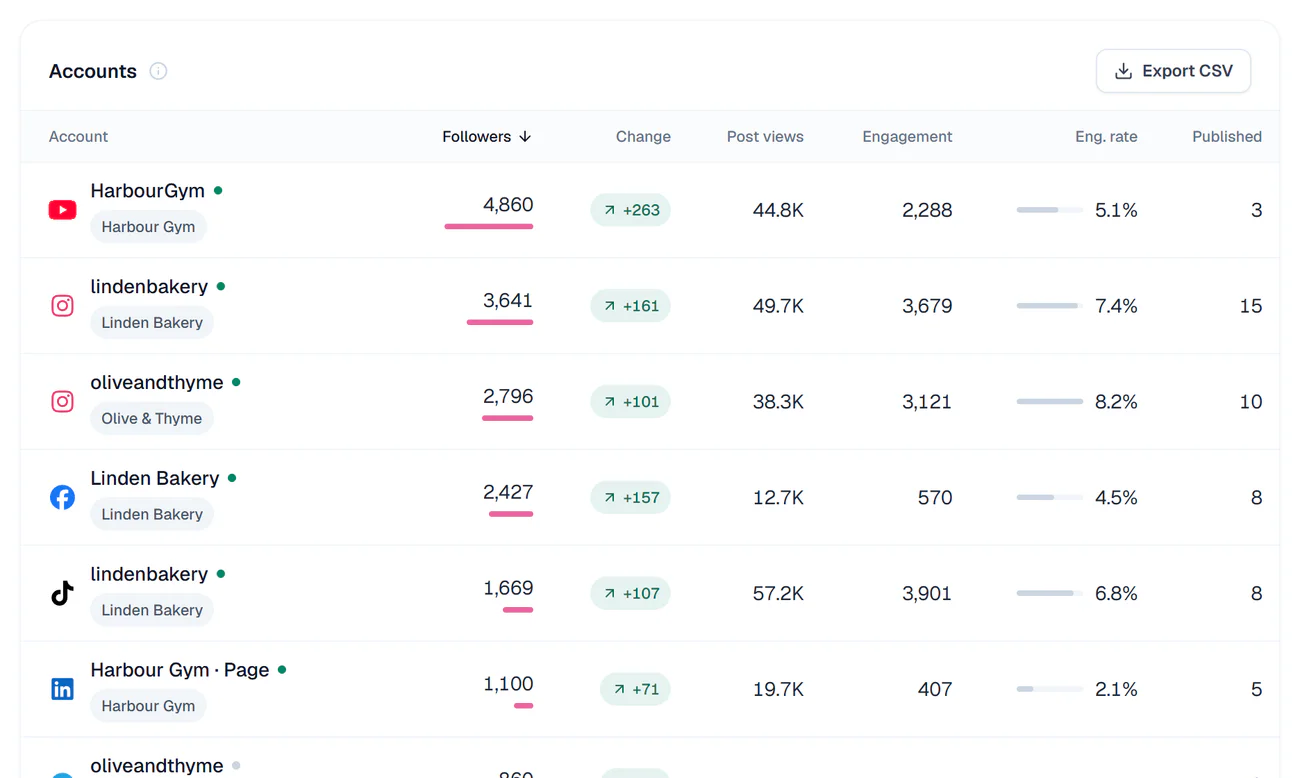
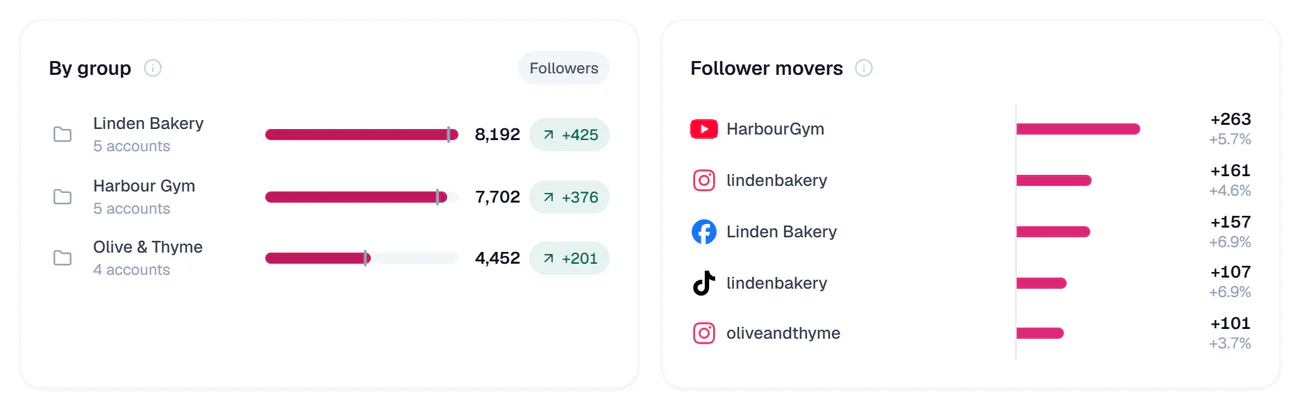
Compare, filter, export
Any range, against the one before
7, 30 or 90 days, 12 months or any range up to a year, each figure against the period before.
One client per report
Filter by client group or platform. Followers, views, engagement and posts published, by platform and by client group.
Every account in one table
Top posts across every account, and each account’s posts in one sortable table.
CSV export
Of the overview and of each account’s posts.
Engagement by hour
For each account’s own posts, over the last 180 days.
Scoped on Ultra
A teammate sees only the client Groups you assign.
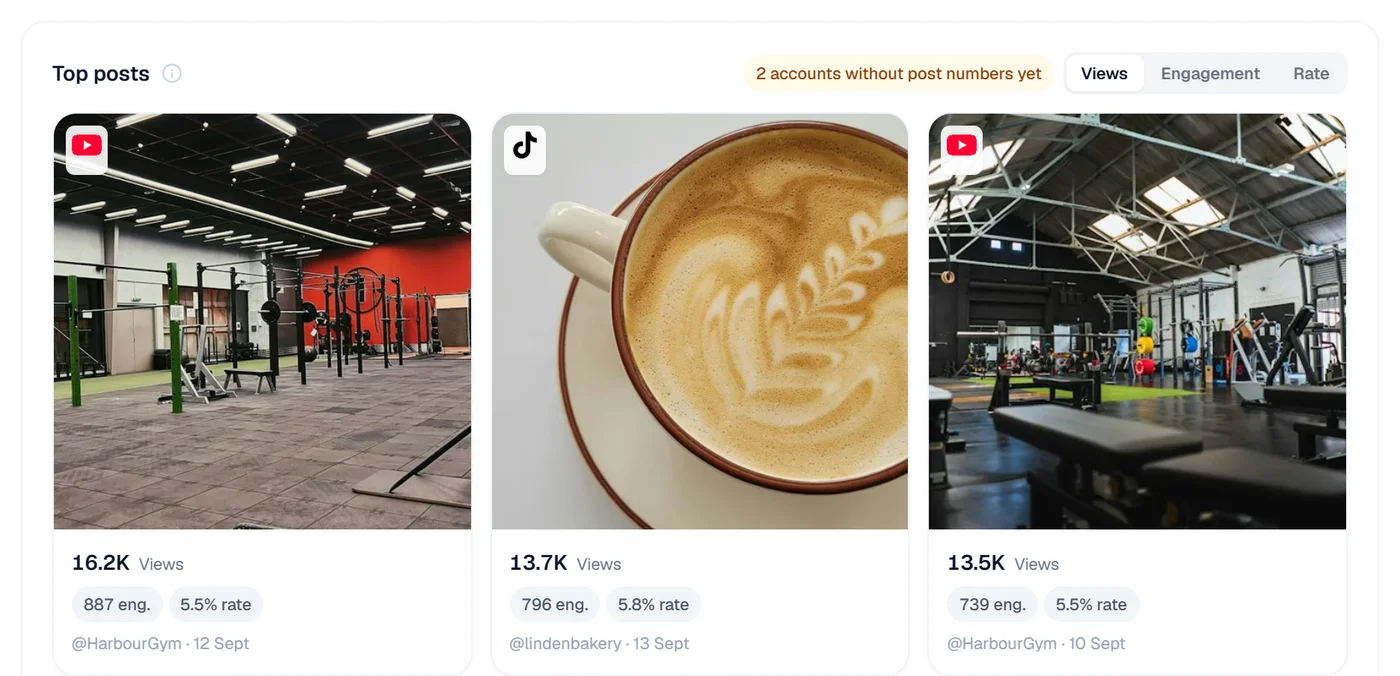
Top posts, across every account
Ranked by views, engagement or rate, whichever client and platform they came from.

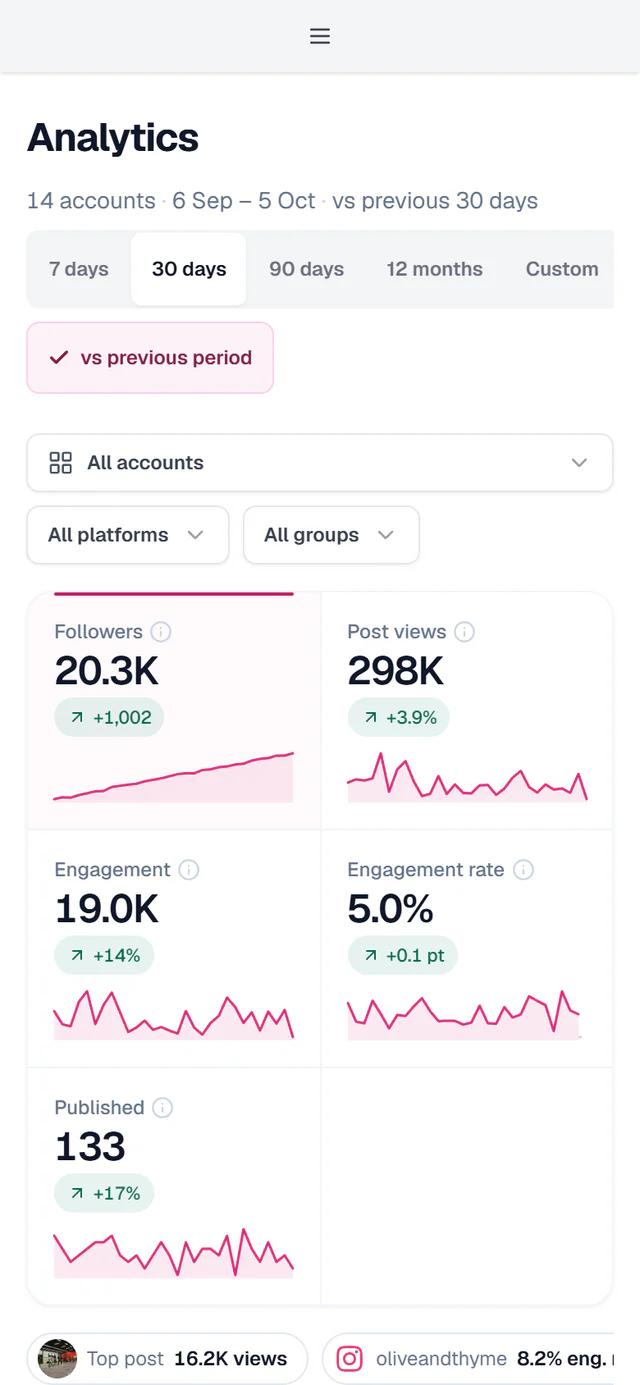
The same numbers, wherever you are
In a phone browser
The whole Analytics page works there too, every account and every range.
Live view
Switch the calendar to Live to see what is actually on your accounts, posts made in the platform's own app included, with their numbers.
Or ask your assistant
Connect your own assistant over MCP, and ask how last month's LinkedIn posts did. It reads the same numbers.
Eleven platforms' analytics, included at €7.99.
CSV export included, for every account you connect.
Start free trial14-day free trialCancel anytime, no questions asked